Data Observability
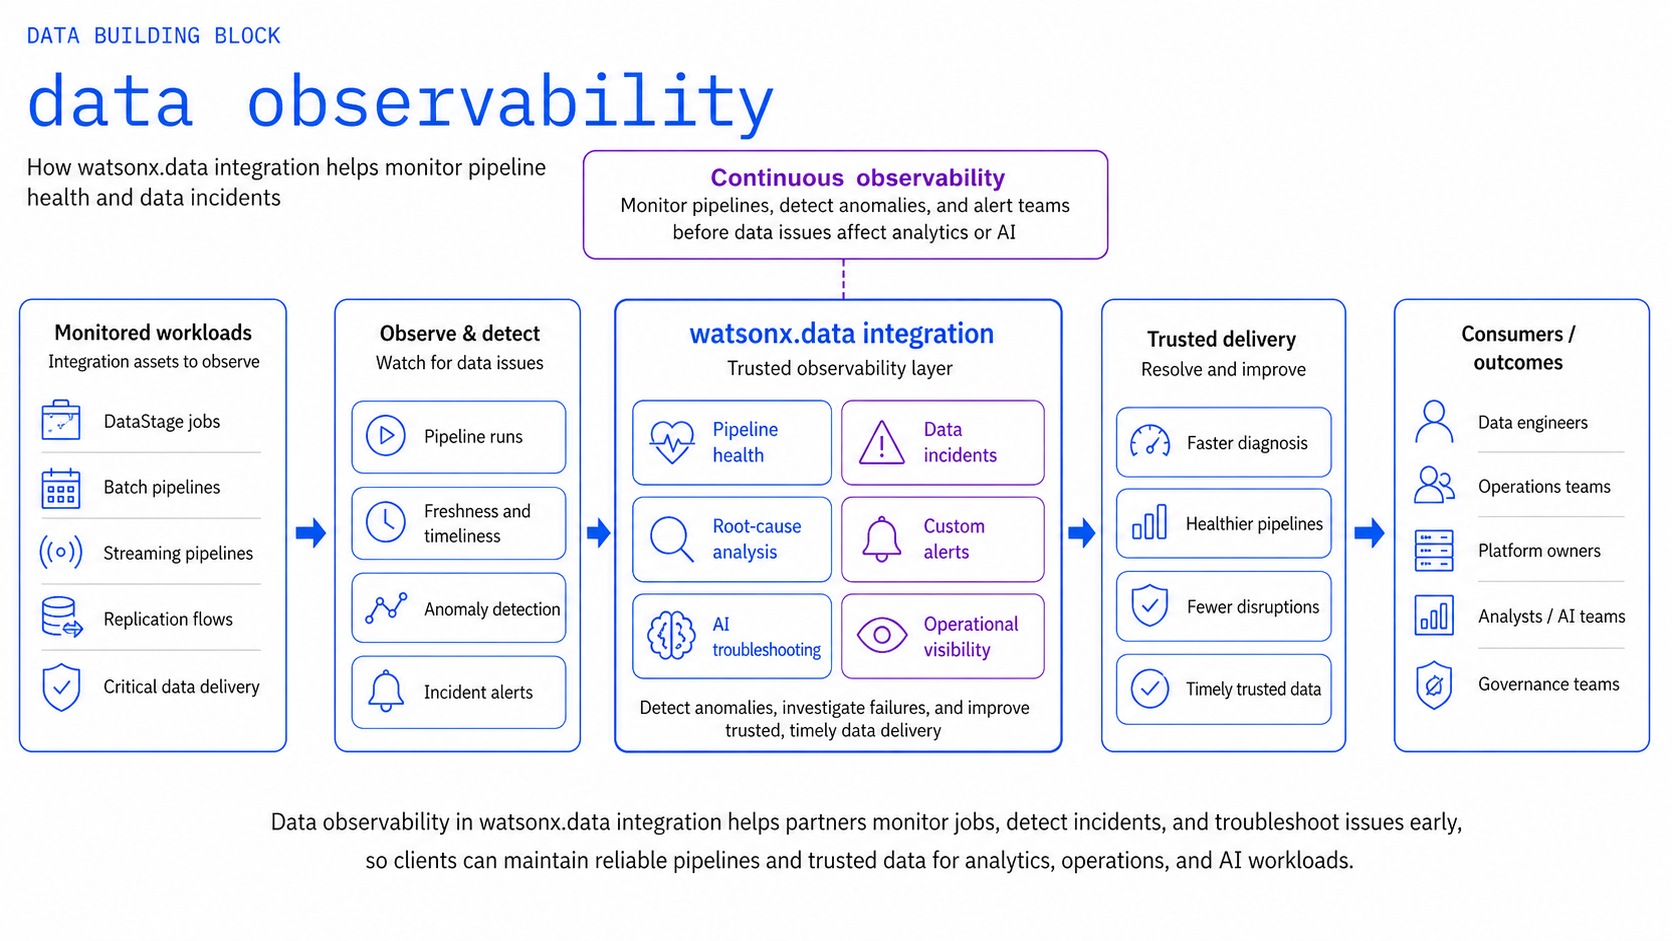
Use IBM watsonx.data integration Data Observability and IBM Data Observability by Databand to detect, investigate and resolve data incidents before unreliable data affects downstream analytics or AI.
Product mapping
- IBM watsonx.data integration — Data Observability capability for monitoring integration processes and investigating incidents
- IBM Data Observability by Databand — pipeline, run, task and dataset monitoring, anomaly detection and alerting; integrates with watsonx.data Spark monitoring
GitHub Repository
The complete source code and examples are available in the GitHub repository:
Why It Matters
Data quality problems are discovered in one of two ways: proactively, through monitoring and alerting, or reactively, when a dashboard is wrong or an AI model produces bad outputs. Data Observability enables the proactive path — surfacing failures, anomalies, staleness and SLA breaches before downstream consumers are affected.
Business Value
Key outcomes
| Outcome | What It Means |
|---|---|
| Detect incidents earlier | Surface abnormal runs, failures, dataset changes and freshness problems before users report them |
| Reduce mean time to resolution | Correlate alerts with pipeline history and execution context for faster triage |
| Protect data SLAs | Monitor whether critical datasets arrive and refresh on time |
| Increase trust in analytics and AI | Reduce the chance that models or dashboards consume incomplete, stale or anomalous data |
| Improve data-engineering productivity | Spend less time manually searching logs across tools |
When to Use
Use Data Observability when:
- Data pipelines are production-critical and failures have downstream business impact.
- You need alerts on run status, duration, row counts, freshness or quality signals.
- Data transformations span multiple orchestration or integration technologies.
- Teams need a common incident view across pipelines and datasets.
- Spark workloads in watsonx.data need deeper pipeline and dataset tracking.
What to Observe
| Area | Examples |
|---|---|
| Pipeline health | Failed runs, task state, duration, unexpected schedule behavior |
| Data health | Freshness, volume, schema or metric anomalies, data quality signals |
| Dependencies | Upstream/downstream datasets and pipeline relationships |
| Operational context | Logs, run parameters, historical trends, alert severity |
Reference Flow
flowchart LR
    P["DataStage / Spark / orchestration / custom pipelines"] --> O["Data Observability / Databand"]
    O --> M["Metrics + metadata + lineage context"]
    M --> A["Alerts"]
    A --> I["Incident investigation"]
    I --> R["Remediation"]
What to Demonstrate
- Register or integrate a representative pipeline.
- Show active and historical runs.
- Configure an alert for a realistic condition — failed run, unusual duration or stale data.
- Trigger a controlled failure or anomaly.
- Show alert details and the operational context used for triage.
- Demonstrate the path from incident to remediation.
Design Considerations
Alert on what matters
- Prioritize observability for data products with explicit business SLAs.
- Alert on actionable conditions — excessive low-value alerts create alert fatigue.
- Combine pipeline-level monitoring with dataset-level metrics for better root-cause analysis.
- Define ownership and escalation paths for critical data products.
- Use historical baselines to distinguish normal variance from meaningful anomalies.
IBM Products Used
| Product | Role |
|---|---|
| IBM watsonx.data integration | Integration platform including Data Observability capability |
| IBM Data Observability by Databand | Pipeline and dataset monitoring, anomaly detection and alerting |
| Data Observability product page | Overview of IBM's data observability offering |